
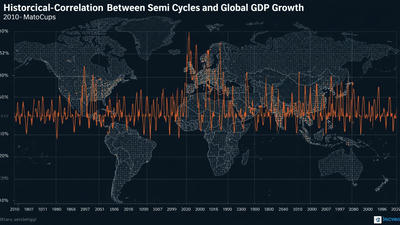
Historical Correlation Between Semi Cycles and Global GDP Growth
Semiconductor industry cycles and global GDP growth are deeply intertwined. Semiconductors power consumer electronics, data centers, automobiles, industrial automation, and countless embedded systems that form the backbone of modern economic activity. Conversely, macroeconomic conditions shape consumer demand, corporate capex, and the financing environment that determine fab investment and inventory behavior.

Defining the actors: what we mean by “semi cycles” and “GDP growth”
Before analyzing correlation, it helps to define terms:
Semiconductor cycles. The semiconductor industry is inherently cyclical. Cycles typically comprise expansion phases (tight capacity, rising prices, strong order books, rising capex) and contraction phases (inventory overhang, price pressure, weak utilization, capex cuts). These cycles are driven by demand volatility across end markets, inventory dynamics, and the long lead times for capacity additions.
Global GDP growth. Gross Domestic Product growth measures the overall expansion in economic output across countries. It reflects consumer spending, business investment, government expenditure, and net exports. Global GDP growth is influenced by monetary and fiscal policy, commodity prices, geopolitical events, and structural shifts (demographics, technology adoption).
Why semiconductors and GDP are correlated
There are several structural reasons the semiconductor cycle tracks, and sometimes amplifies, broader economic trends:
1. Semiconductors are leading indicators of tech-driven investment. Capital expenditure on data centers, communications infrastructure, and advanced manufacturing often precedes visible gains in productivity and consumer-facing goods. When businesses and cloud providers increase capex, they order chips and related systems early in the investment cycle.
2. Consumer electronics are cyclically sensitive. Smartphones, PCs, game consoles, and TVs are large-volume drivers of semiconductor demand and are tied closely to consumer confidence and disposable income. In expansions, refresh cycles accelerate; in downturns, discretionary purchases are delayed.
3. Automotive and industrial demand link to economic cycles. Vehicle sales and industrial equipment purchases are tied to broader economic conditions, even as structural trends like electrification and automation add baseline growth. During recessions, fleet renewals and capital equipment purchases often fall, reducing semi demand in these segments.
4. Inventory dynamics create feedback loops. Semiconductor supply chains involve distributors, EMS providers, OSATs, and OEMs. Inventory build-ups during expansions and destocking during contractions can amplify GDP swings. Over-ordering during optimistic periods can lead to painful corrections that depress production and investment, temporarily weakening GDP.
Empirical patterns and historical episodes
Looking at historical episodes reveals recurring patterns in the relationship between semiconductor cycles and GDP growth. While precise statistics depend on data sources and time windows, several robust observations emerge:
Semiconductors lead GDP in many expansions and contractions. Semiconductor production, equipment orders, and industry revenue often accelerate before broader GDP gains become visible. This lead arises because firms acquire chips for new systems early in project lifecycles. Conversely, sharp downturns in capex and consumer demand show up quickly in chip orders and revenues.
Lag structures matter. The lead or lag between semiconductor indicators and GDP varies by episode and segment. For example, equipment orders and foundry utilization can lead GDP by several quarters, while end-device shipments may move more contemporaneously with consumer spending. Memory pricing cycles can be more volatile and sometimes decouple, driven by inventory swings rather than immediate end-market demand.
Amplitude differences exist. Semiconductor cycles tend to be higher amplitude than GDP cycles. A modest slowdown in global GDP can translate into a sharp contraction in some semiconductor subsegments due to high operating leverage and inventory adjustments. Similarly, a targeted boom in AI infrastructure can produce outsized gains in semiconductor revenue even when GDP growth is moderate.
Policy and external shocks create exceptions. Events like financial crises, pandemics, or major trade disruptions can alter typical correlations. For instance, during the COVID-19 pandemic, initial supply disruptions and subsequent demand shocks created atypical swings: supply-constrained segments saw strong growth while others lagged, and fiscal/monetary stimulus later boosted demand for consumer electronics beyond typical GDP-linked patterns.
Case studies: past cycles and GDP interactions

Examining specific historical cycles clarifies how the relationship plays out in practice:
1. Early-2000s tech correction and recovery. Following the late-1990s tech boom, semiconductor equipment and chip demand collapsed as over-investment in dot-com-era infrastructure unwound. Global GDP growth slowed in affected economies, but the recovery in semiconductor investment preceded broader business investment improvements as new architectures and mobile demand emerged.
2. 2008–2009 global financial crisis. Semiconductor demand plunged alongside GDP as consumer spending and corporate capex contracted sharply. The industry experienced steep utilization declines and idled capacity. The subsequent recovery in chips tracked with the recovery in manufacturing and consumer durables.
3. 2017–2018 memory supercycle and 2019 correction. A memory-driven upcycle boosted semiconductor revenue substantially without a commensurate surge in global GDP, illustrating how a subsegment can decouple and create outsized industry swings. The correction that followed contributed to broader equipment order softness but did not precipitate a global GDP collapse—showing amplitude can exceed macro sensitivity yet still remain partially idiosyncratic.
4. Pandemic-era dislocation (2020–2022). The pandemic produced an unusual mix: initial shocks reduced orders, then supply-chain disruption and demand shifts (work-from-home, cloud growth) sparked shortages and surges in some segments. Fiscal and monetary stimulus propped GDP in many regions, but chip cycles were affected by both demand reallocation and supply constraints, complicating the historical correlation.
Quantifying the correlation: practical approaches and limitations
Analysts seeking to quantify the correlation between semiconductor cycles and GDP use a range of indicators and methods:
Leading indicators to track: semiconductor equipment orders, foundry utilization, industry revenue growth, memory ASPs, inventory days across distributors, and OSAT utilization. These indicators can be compared against quarterly GDP growth using cross-correlation analysis and Granger causality testing to identify lead-lag relationships.
Time-series considerations: Correlation strength varies across time horizons. Short-window correlations (month-to-month) can be noisy; quarterly or annual aggregates produce clearer relationships. Analysts must also adjust for seasonality, calendar effects (e.g., Chinese New Year), and structural regime shifts (new dominant end markets like AI).
Limitations and caveats: The semiconductor industry is not monolithic. Memory, foundry, packaging, and discrete markets have distinct dynamics. An aggregate semiconductor index can obscure divergent subsegment behavior. Additionally, policy interventions, inventory cycles, and one-off demand shocks (e.g., hyperscaler procurement spikes) can distort correlations.
Interpreting signals for decision-making

Understanding the historical correlation is useful, but applying it prudently requires recognizing nuance. Here are practical ways different stakeholders can use the relationship.
Investors: Use semiconductor indicators as a high-frequency filter on macro expectations. Rising equipment orders and foundry utilization often presage capex-driven industrial cycles and can signal earlier-than-expected GDP momentum. Conversely, sudden weakness in chip orders may indicate a sharper slowdown in durable goods and enterprise capex. However, differentiate between broad-based demand and subsegment-driven spikes to avoid overreacting to memory or hyperscaler-specific booms.
Corporate planners and procurement: Treat semi-cycle signals as inputs for inventory and capex planning. When chip orders lead GDP, proactive supply agreements and segmented inventory strategies can protect production during tight phases. In downturns, flexible supply agreements and options can reduce the cost of excess inventory.
Policy makers: Semiconductor indicators can provide early warning of shifts in industrial activity. For economies with large manufacturing bases, falling equipment orders and fab utilization may presage broader manufacturing slowdowns, suggesting timely policy support. Conversely, concentrated chip-driven booms that do not reflect broad GDP strength warrant cautious policy calibration to avoid overheating narrow segments.
Practical framework: integrating semi-cycle signals into forecasting
To operationalize the correlation, adopt a layered approach:
Layer 1 — Signal monitoring: Track leading semiconductor metrics weekly/monthly (equipment orders, utilization, memory ASPs, inventory days). Use moving averages to filter noise.
Layer 2 — Cross-correlation testing: Periodically compute cross-correlations between semiconductor indicators and quarterly GDP growth to update lead-lag estimates. Adjust for structural breaks (e.g., emergence of AI hyperscaler demand) that change historical relationships.
Layer 3 — Scenario mapping: Build scenarios where semiconductor-led demand is either broad-based (affecting cloud, automotive, and industrial) or narrow (memory or single-customer-driven). Map the macroeconomic impact of each scenario on capex, employment, and durable goods spending.
Layer 4 — Policy and strategy triggers: Define triggers for corporate and policy actions (e.g., if foundry utilization rises above X% and equipment orders increase Y% year-over-year, accelerate capacity or adjust fiscal support). These triggers must be periodically recalibrated as technology and market structure evolve.
Exceptions and decoupling risks
While correlation is useful, several trends risk weakening the historical link between semiconductors and GDP:
1. Concentration of demand in hyperscalers. Large cloud providers can create substantial semiconductor demand without a proportional lift in global GDP if their investments are confined to data-center expansion rather than broad-based consumer or industrial activity.
2. Vertical integration and inventory management improvements. Better forecasting, longer-term supply contracts, and strategic inventory practices can dampen the amplitude of semiconductor cycles, reducing the industry's tendency to amplify GDP swings.
3. Technological shifts. Radical shifts—widespread adoption of edge compute, new memory technologies, or disruptive packaging—could change where and how chips influence GDP, potentially altering historical correlations.
Conclusions and strategic implications
The historical correlation between semiconductor cycles and global GDP growth is strong enough to make semiconductors a valuable leading indicator for investors, corporate planners, and policymakers—but not so deterministic that it should be used in isolation. Semiconductor indicators capture early changes in capital expenditure, consumer electronics demand, and industrial adoption that often foreshadow broader economic movements. However, subsegment-specific booms (memory, hyperscalers) and episodic shocks (pandemics, trade policy changes) can create temporary decoupling.
Practically, stakeholders should integrate semiconductor signals into a multi-factor forecasting framework: use high-frequency semi metrics to provide early warning and scenario inputs, but corroborate with other macro indicators—employment, credit conditions, consumer confidence, and commodity markets—to form balanced views. For investors, focus on the quality of order backlogs and breadth of demand to distinguish durable cycles from narrow spikes. For corporate leaders, use semi-cycle signals to inform inventory segmentation, supplier agreements, and product roadmaps. For policymakers, monitor chip-related capex and utilization as part of an early-warning toolkit for manufacturing and investment cycles.
In short, semiconductors matter to the macroeconomy both directly and indirectly. When chip demand is rising broadly, it typically precedes stronger global investment and production. But because the semiconductor industry can also drive isolated, high-amplitude swings, nuanced analysis—segment-level, lead-lag aware, and scenario-driven—is essential to translate historical correlation into practical decision-making.
You May Like

Narrowing Spread Between NAND Spot and Contract Prices in 2026 – A Signal
By 2026, one of the most watched metrics in the NAND flash market has started to shift in a subtle but meaningful way: the spread between spot prices and long‑term contract prices is narrowing. For casual observers, this may look like just another incremental change in a notoriously volatile industry. For memory makers, module houses, device OEMs, and data center buyers, however, a tightening gap between spot and contract prices is a signal—a reflection of evolving supply–demand balance, risk perceptions, and strategic behavior on both sides of the market.

Price Divergence Trading Strategies Between NAND Flash and DRAM ETFs
NAND flash and DRAM sit at the core of AI storage and computing power. Both are memory, but they are not the same business. DRAM is main memory—fast, volatile, and central to high‑bandwidth workloads like AI training and inference. NAND is non‑volatile storage—slower than DRAM, but crucial to persistent data and large‑scale object storage. The cycles that drive their pricing and margins overlap, yet they often diverge. That divergence is where trading strategies between NAND and DRAM ETFs become interesting.

China’s HBM Localization Progress: The Catch-Up Pace of CXMT and XMC
China’s drive to localize advanced memory technologies has accelerated over the past several years. High-Bandwidth Memory (HBM) sits near the center of that strategy because it is integral to AI accelerators, high-performance computing (HPC) and other strategic compute platforms. Two domestic players—ChangXin Memory Technologies (CXMT) and XMC (Xianghui Memory, commonly referred to as XMC)—have become focal points in assessing how quickly China can close the gap with international incumbents on HBM die, stacking, and packaging.

Thermal Simulation Challenges and Solutions in 3DIC AI Chip Design
As AI workloads push chips to deliver ever higher compute density, designers are increasingly turning to three‑dimensional integration (3DIC) to stack dies vertically and pack more functionality into limited footprints. While 3DIC architectures unlock significant performance and bandwidth advantages, they also introduce complex thermal behaviors that are far harder to predict and manage than in traditional 2D layouts.

An Attempt at Compiling a Memory+Compute Fusion Thematic Index – A Dual-Track Framework
Most AI investors talk about “compute” as if it were the whole story: GPUs, accelerators, chips, cores. But every one of those cores needs somewhere to read from and write to. Memory and storage define how wide the data highway really is. In practice, AI performance is a fusion of compute and memory, not a solo act. So why do so many indices and ETFs separate them into different silos—one for semiconductors, one for memory, one for data centers—when the actual workloads keep blending them?

Surging Demand for Laser Drilling and Plasma Dicing Equipment in Advanced Packaging
Advanced packaging has become one of the semiconductor industry’s most important growth engines, and it is now pulling a surprising set of process tools into the spotlight. Among the most in-demand are laser drilling and plasma dicing equipment. These machines sit close to the heart of heterogeneous integration, fan-out packaging, wafer thinning, TSV formation, glass substrate processing, and other advanced flows where precision, yield, and throughput matter enormously. As packaging moves from a back-end afterthought to a strategic platform, the equipment used to shape, open, and separate materials has become just as important as the dies themselves.
D2D Interface Bandwidth and Latency Comparison in Chiplet Architectures
Chiplet architecture has turned the package into a real performance battleground. Once multiple dies are placed side by side or stacked within the same advanced package, the quality of the die-to-die, or D2D, interface becomes one of the most important determinants of system behavior. Bandwidth is no longer a nice-to-have metric, and latency is no longer a small implementation detail. Together, they shape whether a chiplet system feels nearly monolithic or frustratingly fragmented.

Stock Selection Logic and Alpha Validation of ESG-Themed Semi ETFs
Semiconductor themed ETFs are no longer just about growth and cycles. A growing subset now layers environmental, social, and governance (ESG) criteria on top of traditional sector exposure. These ESG semi ETFs promise two things at once: access to one of the market’s most powerful secular themes, and alignment with sustainability and governance standards. The pitch is appealing, but it raises two hard questions. First, how exactly are these stocks being selected? Second, does the ESG overlay help, hurt, or leave alpha unchanged?